Things I Wish I Knew When I Started Debugging Rails
October 20, 2016
Recently I was thinking back to when I first starting working with Rails, and just doing development in general. A list quickly came to mind of things that I wish I had learned much earlier on. This post is a few of those things specifically about debugging. May you learn them earlier in your career than I did!
Debugging Tips
Debugging. The core of the programmer existence. Or put in less grandeur: we make a lot of mistakes. Annoying typos, silent failing errors, or just plain wrong syntax. I've come to think that the best programmers aren't those who make the least amount of mistakes, but those who are able to quickly and systematically find and fix them.
Here's a couple common debugging tips you may not be aware of:
#1: "When in doubt, print more out." - Some Wise Person
def some_method
  puts "IS ANYONE OUT THERE"
  ...
end
Possibly one the oldest forms of debugging, just printing stuff to the screen is actually very effective. Watching the messages (or lack of messages!) can tell you a lot about what's going on in the system.
Even something like printing a series of asdf, asdfasdf, asdlfkjasdlfasldf; to chase down the code execution path can save you a lot of time tweaking code that's not even being called. Most modern languages also have the ability to print useful interpretations of objects or variables to inspect their internal state.
Something I've seen a lot in newer developers (and something I catch myself doing even now as well) is a vicious cycle of change after change hoping to see the correct result—only to take a step backwards and figure out that that particular section of code isn't even being called. Le sigh.
#2: Halting execution to inspect the current state
A step up from just printing out messages or data is to stop the execution flow and poke around yourself.
If you're in the Ruby world, pry is an amazing tool. Pry is very powerful, and it allows you to stop execution flow at any point by dropping in binding.pry.
Say you have a ruby file test.rb:
# test.rb
require 'pry'

class Test
  def self.some_method
    puts "Start"

    binding.pry

    puts "End"
  end
end
And you run it like this:
$ gem install pry
Successfully installed pry-0.10.4
Parsing documentation for pry-0.10.4
Done installing documentation for pry after 2 seconds
1 gem installed

$ irb
irb(main):001:0> require_relative 'test'
=> true
irb(main):002:0> Test.some_method
Start

From: test.rb @ line 7 Test.some_method:

     4: def self.some_method
     5:   puts "Start"
     6:
 =>  7:   binding.pry
     8:
     9:   puts "End"
    10: end

[1] pry(Test)> puts "I can do anything here!"
I can do anything here!
=> nil
[2] pry(Test)> 1 + 1
=> 2
[3] pry(Test)>
You can do anything inside of the pry statement that you can do inside your project at that point in time. Inspect objects, instance variables, run database queries, check session variables, etc.
Rails actually automatically adds a similar gem to any new project called byebug. It acts similar to pry in that you can invoke a console by typing byebug somewhere in the code. Both gems have similar mechanics. Type continue to continue the execution flow, or exit to stop it entirely (byebug also has a shortcut of c for continue).
Very useful stuff.
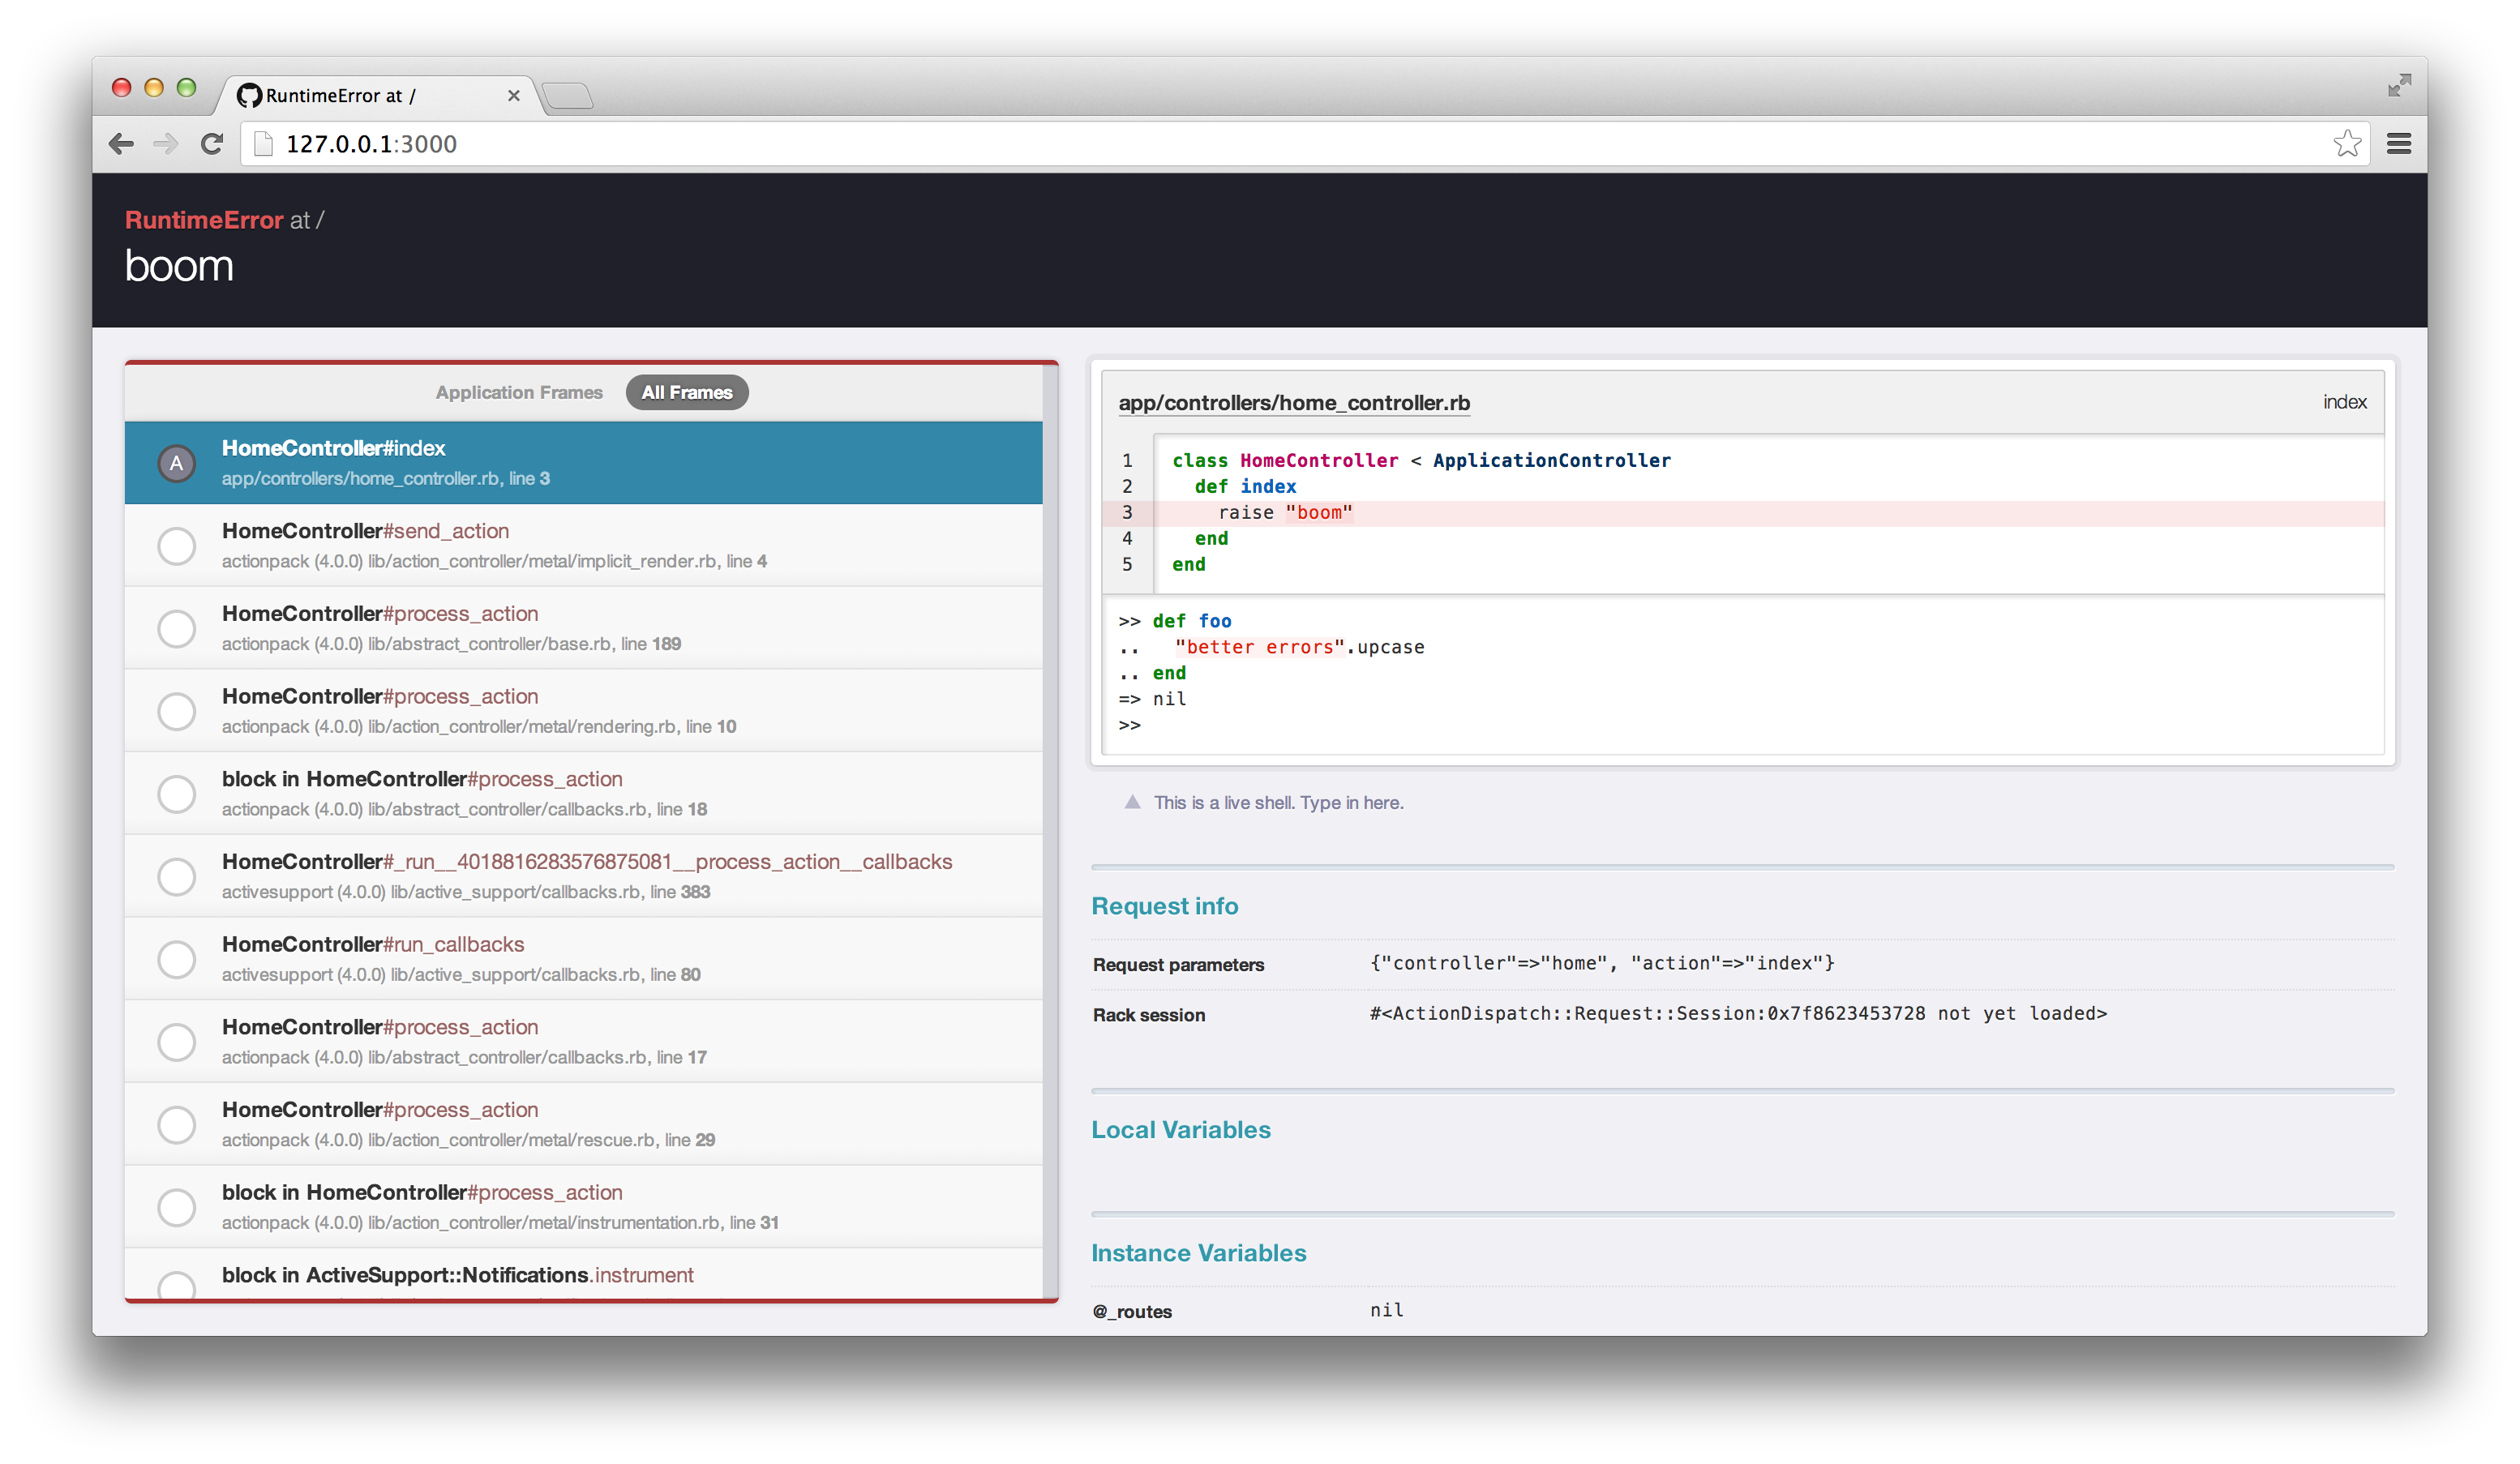
The better_errors gem
Better Errors is a gem that I will add to a lot of my projects. When an error occurs, it not only shows you a better representation of what and where something went wrong, but it also has an interactive console for you to poke around the state of the system when the error occurred. Rather than having to preemptively put in a binding.pry, Better Errors does that for you whenever an error occurs.
Here's an example from their github page:
#3: Check the logs
The logs are your friend. They catch things you didn't even know you'd need until you go searching for them. By default, when you run rails s, after the server starts, it will begin to print out logs as you use your webserver.
$ rails s
=> Booting WEBrick
=> Rails 4.2.6 application starting in development on http://localhost:3002
=> Run `rails server -h` for more startup options
=> Ctrl-C to shutdown server
[2016-10-19 22:49:47] INFO  WEBrick 1.3.1
[2016-10-19 22:49:47] INFO  ruby 2.2.2 (2015-04-13) [x86_64-darwin14]
[2016-10-19 22:49:47] INFO  WEBrick::HTTPServer#start: pid=19988 port=3002

Started GET "/" for ::1 at 2016-10-19 22:49:49 -0500
Processing by Rails::WelcomeController#index as HTML
  Rendered /Users/john/.rbenv/versions/2.2.2/lib/ruby/gems/2.2.0/gems/railties-4.2.6/lib/rails/templates/rails/welcome/index.html.erb (7.0ms)
Completed 200 OK in 24ms (Views: 16.0ms | ActiveRecord: 0.0ms)
(Side note: some web servers like Unicorn don't spit out logs by default. You can use the tail command with the -f or "follow" flag to see the logs that are generated in realtime: $ tail -f log/development.log)
Stacktraces
Stacktraces can be an eyesore to look at, and sometimes even confusing or undecipherable. At least in Rails, the top of the trace is very useful for finding out exactly what went wrong.
Near the middle and bottom there's gonna be stuff like this that is useful if you were trying to debug the internals of Rails:
...
Rendered /Users/john/.rbenv/versions/2.2.2/lib/ruby/gems/2.2.0/gems/actionpack-4.2.6/lib/action_dispatch/middleware/templates/rescues/_source.erb (3.4ms)
Rendered /Users/john/.rbenv/versions/2.2.2/lib/ruby/gems/2.2.0/gems/actionpack-4.2.6/lib/action_dispatch/middleware/templates/rescues/_trace.html.erb (1.6ms)
Rendered /Users/john/.rbenv/versions/2.2.2/lib/ruby/gems/2.2.0/gems/actionpack-4.2.6/lib/action_dispatch/middleware/templates/rescues/_request_and_response.html.erb (0.9ms)
...
99% of the time this is not useful to you, but near the top you'll find more useful information. It will show you the type of error (500), which file it occurred in (app/controllers/home_controller.rb), and what line it occurred on: line three (...home_controller.rb:3).
Started GET "/" for ::1 at 2016-10-19 22:58:56 -0500
Processing by HomeController#index as HTML
Completed 500 Internal Server Error in 1ms (ActiveRecord: 0.0ms)

RuntimeError (BOOOOOOOOOOOOOOOM):
  app/controllers/home_controller.rb:3:in `index'
...
Reading the error message carefully and going directly to the problem instead of just a wildly thrashing the code will save A TON of wasted time changing things that aren't even related to the problem.
Production logs
I never realized how useful logs were until a got a production bug report.
"A user can't login. Can you fix it?"
Um, is there more information than that? Turns out, if you're saving production logs, there is!
Heroku
If you're using Heroku, there are several free addons that will capture past logs for a good amount of time (just search for "log" in the resources addons section). Learning how to search the logs (remember the useful bits of the stacktrace) will help you track down the seemingly impossible.
Also, if you're able to reproduce the error on production, you can tail the logs similar to how you do in development with heroku logs --tail <remote or app name>.
Conclusion
I hope these tips will help you avoid pain and frustration throughout your dev career! If you have a favorite debugging tip I didn't mention, I'd love to hear from you via [email](mailto:johnmosesman@gmail.com?subject=Debugging tips) or on twitter.
If you'd like to read some more tips, read on to Part 2!
Thanks for reading!
John